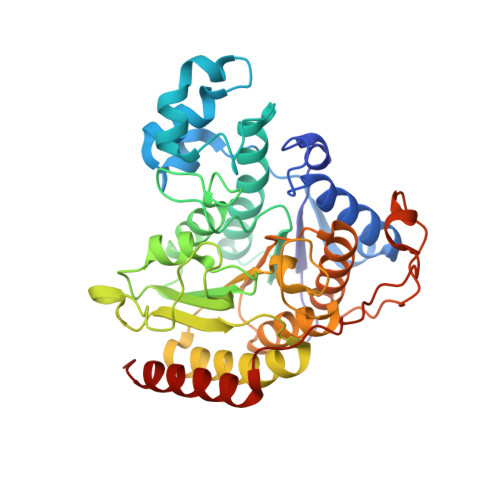
4LY1

Structure of Human HDAC2 in complex with inhibitor 4-(acetylamino)-N-[2-amino-5-(thiophen-2-yl)phenyl]benzamide


Experimental Data Snapshot

  • Method: X-RAY DIFFRACTION
  • Resolution: 1.57 Å
  • R-Value Free: 0.187 
  • R-Value Work: 0.169 
  • R-Value Observed: 0.170 

Starting Model: experimental
View more details

wwPDB Validation   3D Report Full Report


Ligand Structure Quality Assessment 


This is version 1.2 of the entry. See complete history


Literature

Histone Deacetylase (HDAC) Inhibitor Kinetic Rate Constants Correlate with Cellular Histone Acetylation but Not Transcription and Cell Viability.

Lauffer, B.E.Mintzer, R.Fong, R.Mukund, S.Tam, C.Zilberleyb, I.Flicke, B.Ritscher, A.Fedorowicz, G.Vallero, R.Ortwine, D.F.Gunzner, J.Modrusan, Z.Neumann, L.Koth, C.M.Lupardus, P.J.Kaminker, J.S.Heise, C.E.Steiner, P.

(2013) J Biol Chem 288: 26926-26943

  • DOI: https://doi.org/10.1074/jbc.M113.490706
  • Primary Citation of Related Structures:  
    4LXZ, 4LY1

  • PubMed Abstract: 

    Histone deacetylases (HDACs) are critical in the control of gene expression, and dysregulation of their activity has been implicated in a broad range of diseases, including cancer, cardiovascular, and neurological diseases. HDAC inhibitors (HDACi) employing different zinc chelating functionalities such as hydroxamic acids and benzamides have shown promising results in cancer therapy. Although it has also been suggested that HDACi with increased isozyme selectivity and potency may broaden their clinical utility and minimize side effects, the translation of this idea to the clinic remains to be investigated. Moreover, a detailed understanding of how HDACi with different pharmacological properties affect biological functions in vitro and in vivo is still missing. Here, we show that a panel of benzamide-containing HDACi are slow tight-binding inhibitors with long residence times unlike the hydroxamate-containing HDACi vorinostat and trichostatin-A. Characterization of changes in H2BK5 and H4K14 acetylation following HDACi treatment in the neuroblastoma cell line SH-SY5Y revealed that the timing and magnitude of histone acetylation mirrored both the association and dissociation kinetic rates of the inhibitors. In contrast, cell viability and microarray gene expression analysis indicated that cell death induction and changes in transcriptional regulation do not correlate with the dissociation kinetic rates of the HDACi. Therefore, our study suggests that determining how the selective and kinetic inhibition properties of HDACi affect cell function will help to evaluate their therapeutic utility.


  • Organizational Affiliation

    From the Departments of Neuroscience.


Macromolecules
Find similar proteins by:  (by identity cutoff)  |  3D Structure
Entity ID: 1
MoleculeChains Sequence LengthOrganismDetailsImage
Histone deacetylase 2
A, B, C
369Homo sapiensMutation(s): 0 
Gene Names: HDAC2
EC: 3.5.1.98 (PDB Primary Data), 3.5.1 (UniProt)
UniProt & NIH Common Fund Data Resources
Find proteins for Q92769 (Homo sapiens)
Explore Q92769 
Go to UniProtKB:  Q92769
PHAROS:  Q92769
GTEx:  ENSG00000196591 
Entity Groups  
Sequence Clusters30% Identity50% Identity70% Identity90% Identity95% Identity100% Identity
UniProt GroupQ92769
Sequence Annotations
Expand
  • Reference Sequence
Small Molecules
Ligands 6 Unique
IDChains Name / Formula / InChI Key2D Diagram3D Interactions
20Y
Query on 20Y

Download Ideal Coordinates CCD File 
J [auth A],
R [auth B],
X [auth C]
4-(acetylamino)-N-[2-amino-5-(thiophen-2-yl)phenyl]benzamide
C19 H17 N3 O2 S
ABZSPJVXTTUFAA-UHFFFAOYSA-N
NHE
Query on NHE

Download Ideal Coordinates CCD File 
N [auth B]2-[N-CYCLOHEXYLAMINO]ETHANE SULFONIC ACID
C8 H17 N O3 S
MKWKNSIESPFAQN-UHFFFAOYSA-N
PG4
Query on PG4

Download Ideal Coordinates CCD File 
G [auth A]
H [auth A]
I [auth A]
O [auth B]
P [auth B]
G [auth A],
H [auth A],
I [auth A],
O [auth B],
P [auth B],
Q [auth B],
V [auth C],
W [auth C]
TETRAETHYLENE GLYCOL
C8 H18 O5
UWHCKJMYHZGTIT-UHFFFAOYSA-N
ZN
Query on ZN

Download Ideal Coordinates CCD File 
D [auth A],
K [auth B],
S [auth C]
ZINC ION
Zn
PTFCDOFLOPIGGS-UHFFFAOYSA-N
CA
Query on CA

Download Ideal Coordinates CCD File 
E [auth A],
L [auth B],
T [auth C]
CALCIUM ION
Ca
BHPQYMZQTOCNFJ-UHFFFAOYSA-N
NA
Query on NA

Download Ideal Coordinates CCD File 
F [auth A],
M [auth B],
U [auth C]
SODIUM ION
Na
FKNQFGJONOIPTF-UHFFFAOYSA-N
Binding Affinity Annotations 
IDSourceBinding Affinity
20Y BindingDB:  4LY1 Ki: min: 0.2, max: 1.5 (nM) from 2 assay(s)
Kd: min: 38.1, max: 55.2 (nM) from 2 assay(s)
IC50: min: 1, max: 204 (nM) from 11 assay(s)
PDBBind:  4LY1 Kd: 55.2 (nM) from 1 assay(s)
Experimental Data & Validation

Experimental Data

  • Method: X-RAY DIFFRACTION
  • Resolution: 1.57 Å
  • R-Value Free: 0.187 
  • R-Value Work: 0.169 
  • R-Value Observed: 0.170 
  • Space Group: P 21 21 21
Unit Cell:
Length ( Å )Angle ( ˚ )
a = 92.034α = 90
b = 97.49β = 90
c = 138.922γ = 90
Software Package:
Software NamePurpose
PHASERphasing
BUSTERrefinement
HKL-2000data reduction
SCALEPACKdata scaling

Structure Validation

View Full Validation Report


Ligand Structure Quality Assessment 


Entry History 

Deposition Data

Revision History  (Full details and data files)

  • Version 1.0: 2013-08-21
    Type: Initial release
  • Version 1.1: 2013-10-02
    Changes: Database references
  • Version 1.2: 2023-09-20
    Changes: Data collection, Database references, Derived calculations, Refinement description